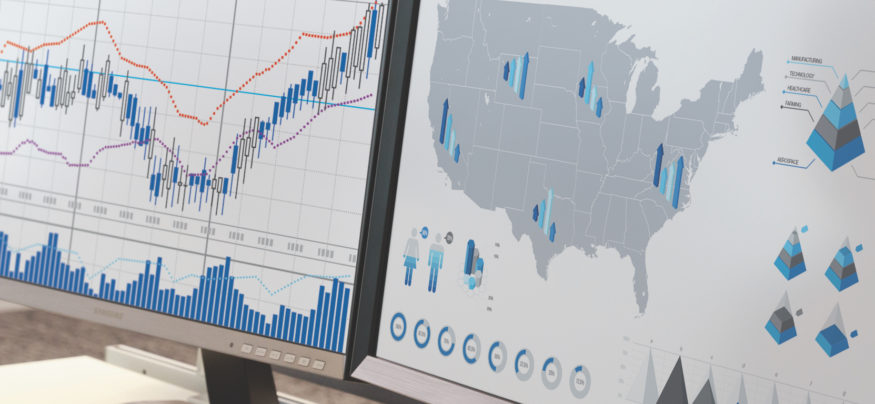
Data, as anyone in business will tell you, is hot these days. Thanks to a new focus on government transparency, more data than ever is now surfacing to help businesses make informed decisions.
That’s why there’s cause to cheer a new initiative between the MIT Media Lab and Deloitte that makes advances in government transparency by allowing data from federal and state governments to be accessible for the first time. The site, datausa.io, is free and features open-source software. Cesar A. Hidalgo, an assistant professor of media arts and sciences at the MIT Media Lab, told The New York Times that the website was devised to “transform data into stories.”
The site offers all kinds of data. As Fast Co. reported, you can learn interesting statistics from the site such as how many Vietnam veterans live in Chicago, the average wage for a construction worker and what percentage of people in Los Angeles have college degrees. Best of all, the interface is elegant and simple, much like a standard search engine. The answers are rendered like an infographic, and the visualizations are powered by D3plus, an open-source visualization engine that was created by members of the Datawheel team. The information in the site is organized by topic. Type in “Newark, NJ,” for instance, and the site tells you the population (280,577), the median income ($35,947) and median age (31.7). From there, you can drill down into fields including demographics, economy and education. Much of the data is from the U.S. Census, which has recently started building out its own API.
Data Utility
Citizens can use the data for anything they want. Hidalgo told Fast Co. that the information can help college students figure out which career paths pay best, or aid entrepreneurs looking for a new place to set up a business by outlining what the local workforce offers.
Hidalgo has been talking up the utility of data visualization for some time. In a 2014 interview with Wired, he praised the ability of a data visualization of his home country of Chile to imagine how the economy might develop over the next few years. “Looking at this fingerprint, you have something that allows you to work out what kinds of things will happen in future,” he said.
Government Data Surfaces
As previously noted here, government transparency is a rising initiative since government agencies are under pressure to make data more accessible to their own departments, as well as to the public. This so-called open data movement ensures that everyone is able to use the information however they wish, including for commercial purposes. In the U.S, the movement for data disclosure began with the 2009 Open Data Initiative, which required that all agencies publish online and register at data.gov a minimum of three high-value data sets.
The movement is good news for many industries; a 2013 McKinsey report predicted that, each year, open data is able to help unlock between $3 to $5 trillion in economic value across seven sectors. That assessment hinges on the assumption that the government stays up to date on security to remain efficient, which will require an investment and understanding of the infrastructure that hasn’t always been demonstrated in the past. As the studies show, though, providing data to the masses will reap dividends that will more than justify the expense.
Looking to learn how technology can transform the Federal Government? Samsung for Government offers the support, services, security and devices for high-stakes government work, ready for action out of the box.


