Audience measurement technologies are taking the guesswork out of running digital signage networks, and making it possible to tune and trigger content based on who’s watching, when and why.
A variety of technologies that are competing, but also complementary, are available to help count and profile viewers — data that can then directly shape what’s on screens, and optimize the marketing and messaging opportunities presented by digital signage in a broad variety of use cases.
There are at least three main drivers behind audience measurement technologies:
1. Relevance: When there’s data indicating who’s watching, content can be adjusted and tuned to more specific interests.
2. Accountability: Gross audience estimates no longer work for brand advertisers who get very specific, granular traffic data when they do their marketing online, and now want the same for other media investments.
3. Timeliness: Archival audience data can help people scheduling networks do a better job of turning programming to audience characteristics, and real-time data can adjust programming on the fly.
Assessing Eyeballs
Before breaking down how those technologies work in each case, first look at the types of audience measurement analytics technologies being deployed with and for digital signage networks.
- Computer Vision: Cameras often mounted with smart signage screens or other digital signage displays capture the area within viewing range, and use pattern-detection algorithms to look for and count faces, based on computer and software machine learning. These systems automatically count how many people look and how long they gaze, and are also capable of breaking down audience characteristics by gender and age range. Some of the more sophisticated systems even boast the ability to read viewers’ emotions based on facial geometry (smiles vs. frowns, for example).
- Device Sniffing: When consumers walk into large venues like malls, big box stores, convention centers and airports, there’s a good chance they are carrying smartphones, and a reasonable chance those smartphones have their Wi-Fi activated. Sensor systems can pick up devices that are scanning for available Wi-Fi, and anonymously track where the handsets go within a venue. That data about all those Wi-Fi roaming smartphones gets rolled up into visual reports that track where people go and don’t go within venues, and how those movements change by time of day and other intervals.
- Proximity Sensors: Beacon technology — little low-cost transmitters that can be strategically placed around a venue — serve a variety of purposes when paired with smartphone apps. They can help with venue navigation, pushing location-specific directions to a phone. They can trigger messaging based on proximity to things like specific rooms or departments. And they can produce analytics that help signage network operators understand how people move around a space, and the communications those people receive via the beacons.
- Infrared Sensors: Technologies like infrared beams are used to sense human shapes and count them in order to estimate things like line length at ticket counters and wait times for venue services like food concessions and washrooms.
Putting Data to Work
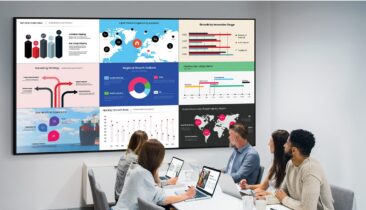
All of those counting technologies produce mountains of data, but the companies behind them understand that to be useful to marketers, merchandisers and business communicators, that data has to be harmonized, rationalized and presented in easily digestible formats for customers. Most vendors provide highly visual dynamic charting that yields quickly understood insights on what’s happening in their venues.
These insights can provide companies with:
- Traffic patterns: Visual aids like heat maps overlay a physical space with progressively intense colors that summarize where people go and don’t go.
- Dwell time: How long people stay in specific spots and where people just pass through.
- Viewing time: Computer vision will track how long, on average, people look at screens, and how it differs by location and type of media.
- Volume: When is the space busy and when is it quiet?
- Demographics: How views change throughout the day, week and month, and whether things like seasonality affect the audience profile.
Actionable Insights for Signage
Making programming decisions about the type, tone, volume and frequency of messaging is much easier when network operators understand when and where people watch and for how long, as well as how those people change through different time periods.
Learn the TCO Advantage of Smart Signage

Download data-driven insights into how smart signage compares to traditional digital displays. Download Now
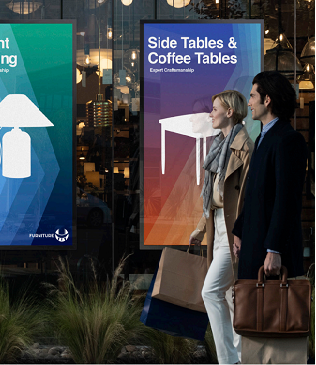
For example, the demographics and traffic patterns of shopping malls can vary dramatically between a Friday and Saturday morning. Content developers can adjust messaging to align with dwell time data, so that marketers aren’t trying to show 30-second promotion videos in an area that, data suggests, commands viewer attention for an average of six seconds.
Digital signage network operators have often had to rely on other data, such as gross foot traffic estimates, to characterize the viewing audience for their screens, for advertising or for other purposes. Detailed, ongoing data — particularly when visualized — provides the necessary credibility for operators to compete with online and other media for marketing dollars.
Paired with a robust digital signage content management system, and smart signage displays that can change messaging dynamically, real-time data opens the opportunity to make advertising, promotion, safety or other messaging relevant to a place and moment. For example, computer vision is being used by a Detroit startup at entertainment venues to analyze line-ups for food services and washrooms, showing in real time where the waits are longest and shortest. The result: balanced and therefore shorter waits — and more sales.
Digital signage is just another technology that can take great advantage of data. But here’s the difference: In most cases, big data generated by devices gets reviewed by analysts, to shape decisions and trends. With digital signage, real-time data can result in real-time messaging — with real impact.
Learn more about how digital signage can provide a new level of customer interaction and engagement for your enterprise.