In this News Insights, Raconteur provides a top five on leveraging geospatial information to address local government challenges. For more insights and out-of-the-box thinking on IoT, AI and more, tune in to our podcast, Business Disrupted. —Samsung Insights editorial team
01 Homeless headcount
Local officials in Aurora, Colorado last year saw a spike in the number of local homeless people – and they’re calling that a win. They say implementing geospatial information systems (GIS) dramatically improved the accuracy of efforts to count this transient population.
The city last year counted 526 homeless individuals, up from 420 the previous year. GIS came into play in the form of a web-based application that allowed field workers to leave behind their traditional clipboards and instead pin the location of homeless individuals to a shared digital map.
The geospatial tool enabled counters to blanket the city, hitting parking lots and other places where the homeless might congregate. “We had all the neighbourhoods gridded out in sections for the teams to cover, so we could cover more ground without duplicating our efforts,” says Shelley McKittrick, City of Aurora homelessness program director.
Looking ahead, the GIS data could drive improved services to the homeless population. “If we have that geographic information on where people tend to cluster, then when housing becomes available, we have a way to find them,” Ms McKittrick says.
02 Digital twin
Boston officials have used the ArcGIS Urban tool to develop a 3D model for zoning and land use. Their interactive site offers realistic profiles of more than 129,000 individual structures.
“We have been experiencing so much development here and we needed to figure out the impacts of that,” says Carolyn Bennett, geospatial data manager at the Boston Planning and Development Agency.
Officials have used the model to ensure new buildings don’t cast shadows over the historic Boston Common green space. They’ve leveraged the 3D facsimile to consider zoning changes and land-use options. The tool has also proved a boon for citizen engagement.
“We want people to be able to see what the effects of development look like and this allows us to do just that,” Ms Bennett says. “Zoning can be very complex and confusing, and this offers a way to visualise that complex information.”
03 Climate change
In New Orleans, city officials have gone live with a website that uses geospatial data as a hedge against the rising impacts of climate change. The public-facing tool shows how transportation, rising water levels and civic infrastructure all are interconnected aspects of the global warming phenomenon.
“This is a tool for building awareness and also a tool for making decisions,” says Tyler Antrup, urban water programme manager in the Office of Resilience and Sustainability.
“For the public at large, it helps to build an understanding of the particular impacts a given neighbourhood may face,” he says. For city planners, a GIS visualisation helps to drive better urban planning. “Suppose we are looking to do a project with a protected bikeway, something that is planted with trees to improve the cooling of the area; this tool allows us to identify parts of the city where the need for that would be greatest.”
04 Traffic management
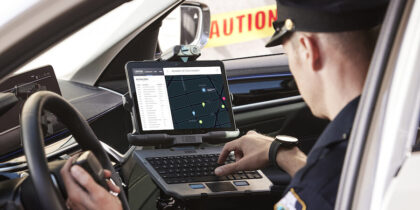
In Georgia’s Cobb County, GIS officials have partnered with the Connected Citizens’ Programme from traffic app Waze to ease the morning commute. They’ve combined civic geospatial data with crowdsourced information from the app to produce a real-time traffic dashboard.
“We provide Waze with the information we have – our planned closures or traffic incidents that we find out about. In return we receive all the crowdsourced Waze reports occurring in Cobb County. That’s far more eyes on the ground than we could possibly have. They can report things faster than we can see them and they fill in gaps for us,” says Lynn Biggs, GIS manager for the Cobb County Department of Transportation.
Operators in the traffic management centre get an at-a-glance view of congestion and can modify signal timing to ease traffic flow. A public-facing element is set to launch soon, to share this same information with drivers.
05 Food availability
In Virginia, the governor’s office has launched an innovative effort to bring a geospatial angle to issues of food availability and healthy eating.
The Virginia Food Access Network (VFAN) uses maps to tell “data stories” around such issues as childhood hunger, access to nutrition and availability of local produce. The data comes from government sources, non-profit organisations, academia and elsewhere.
“They had all this information at the county level, but people’s eyes would glaze over when they saw it on a spreadsheet,” says Rob Rose. As director of the Center for Geospatial Analysis at the College of William and Mary in Williamsburg, Virginia, he helped to develop the GIS component of the government’s VFAN site.
“Maps are one of the best ways to tell these stories. People understand how to look at maps and can use them to easily digest information,” he says.
The governor’s office has expressed a special interest in health outcomes around childhood nutrition, obesity and diabetes. The GIS approach could help to drive better eating, ultimately leading to quantifiable improvements in public health.
“We’re talking about providing school lunches and having fewer hungry kids,” Mr Rose says. “So the number of meals served and the levels of school performance all could become measurable outcomes.”
The post Five transformative uses of geospatial information appeared first on Raconteur.
This article was written by Adam Stone from Raconteur and was legally licensed through the NewsCred publisher network. Please direct all licensing questions to legal@newscred.com.
For more insights and out-of-the-box thinking on IoT, AI and more, tune in to our podcast, Business Disrupted. —Samsung Insights editorial team
![]()