Business communicators are rapidly embracing the capabilities of smart signage displays, data integration tools and web software like HTML5.
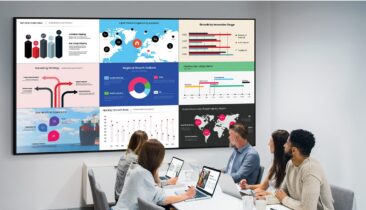
Mash-ups of these technologies are making it possible to create and automate digital dashboards for companies that pull data from business systems and visualize them in dynamic charts and graphics on smart signage located around offices and production facilities.
How It Works
Data-driven dashboards are not a new concept, but they’ve often been limited to the monitor or laptop screens of managers who have specific software applications that track and generate numbers about a business. Today, the emergence of big data tools and storage — and the opening up of software applications to securely share data — means digital signage content management software can extract and present data on displays, and update the numbers and charts as soon as those numbers change in the management system from which they originate.
Here’s a real-world example of that — one that millions of sales managers can relate to: the hyper-popular customer relationship management (CRM) system Salesforce has tools that track sales activity, from the opportunity identification stage to the closed sale. Sales managers, or people working for them, have to regularly generate reports to share with their bosses or the team that show where things stand in the selling pipeline. That usually means PowerPoint slides shown at meetings, emailed around or printed off.
Using a digital dashboard screen and Salesforce’s open programming interface, all the right data can be mapped, shared, replicated and visualized on networked displays around an office, or even across all the sales offices of a global company. Using HTML5, those numbers can work with a predesigned template to reflect the state of sales in anything from graphic bubbles and bar charts to pies and line graphs. When numbers get updated in Salesforce, they’re instantly updated on the signage displays. The net results are fully-informed staffers — and reduced workloads for sales managers who’d rather be chasing new business opportunities.
Dashboards in Use
Here are some examples of how businesses can use real-time dashboards for their workplace communications:
- Energy management: lobby displays showing energy and water consumption rates and trends
- Healthcare: patient loads and average wait times, as well as patient survey responses
- Social media: command centers that monitor and visualize content streams mentioning the company brand in hashtags or handles
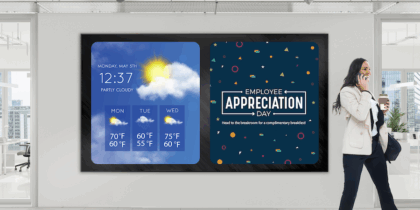
- Transport: Some property management firms and private companies are putting mass transportation dashboards in their lobbies to let tenants and staff know traffic, bus, rail and even rideshare service conditions and times. In simpler terms, airports have been visualizing data for years on their flight arrivals and departure screens.
Getting Started
Real-time dashboards and visualized data may sound intimidating to non-technical business communicators, but they’re surprisingly easy to pull off.
First, identify what your organization wants to communicate. That might be KPIs, health and safety statistics, average call resolution times at a contact center or crop yields. It will, of course, vary by business.
Next, ascertain the source of the data, and whether it’s accessible. The information technology or systems team will need to be involved, as they’ll know all this information.
Then, determine which available information should be presented, what will be the best way to show it as well as who must or should see it and who should not. While transparency in organizations is usually celebrated, there may be good reasons for only certain screens to show specific KPIs or other stats. That reason may be as simple as other departments not being interested.
Learn the TCO Advantage of Smart Signage

Download data-driven insights into how smart signage compares to traditional digital displays. Download Now
The next challenge is sorting out how to get the data on your screens. Because HTML5 is a very common web design tool, a company’s online team or contact agency should have the skills to develop a template. Many digital signage content management systems have tools and templates that make including real-time data easy.
There are also companies that have developed templates designed to work with Salesforce and the most popular KPIs, meaning all a company needs to do is subscribe and set it up — the scripting in the template does the rest. PresentationPoint, a Belgian company, has software that integrates with Microsoft Office applications like PowerPoint and Excel to do dynamic charting. Other companies specialize in business dashboards that could easily be reflected on large digital signage displays.
Some visualized dashboards may not even need specific software applications, templates or an external computer. A web-based dashboard can be shown on a smart display that has an embedded computing device, just by adding a specific web address (URL) and using the built-in browser, set in full-screen mode.
Staying Simple
With all that data becoming available, it’s natural for users to want to populate a screen with a lot of information at once. But a manager’s dashboard on a desktop PC is different from a display that workers will only glance at. The best approach is to tune the content to the audience so that what they see is large enough to view from across a room, easily digested, and easily understood.
Get those things right, and business communicators will be realizing a core goal: getting timely, relevant information to the right people. With automated dynamic charting, you can do that without even thinking about it.
In order to fully reap the benefits of digital signage, developing a Total Cost of Ownership model is essential.